Notes
Geneformer from scratch, part 3: does it capture cell types?
This series builds nano-Geneformer, a tiny, from-scratch version of Geneformer. It is small enough to pretrain on a laptop in a few hours, but with every real piece in place: the tokenizer, a BERT-style transformer, masked-gene pretraining, and the classifiers that ask what it learned. We run the whole thing on a real ulcerative-colitis (UC) atlas of 365,492 cells (Smillie et al. 2019), and by the end we test it for inflammatory-bowel-disease (IBD) biology.
Five parts:
- A cell is a sentence: turn raw expression into rank-ordered gene tokens. (part 1)
- Build and train the BERT: the transformer, and masked-gene pretraining. (part 2)
- Does it capture cell types? This post: read cell identity off the frozen embedding, against a classical baseline.
- Does it capture disease? The harder test, and what moves the needle (scale, weight tying, value-aware tokens).
- In-silico perturbation: delete a gene and watch the model react: gene co-expression, which works, and disease drivers, which don't.
New to single-cell biology or to transformers? The glossary defines the terms from both fields, each with a worked example.
In part 2 we pretrained the model on one self-supervised task (hide genes, guess them back), and its loss fell from random guessing toward a model that has learned which genes co-occur. A falling loss proves the model learned something. It does not prove the learned representation is useful for anything you'd actually do with a cell.
This post runs the first real test of usefulness. It starts with the easiest, most important question you can ask of any single-cell representation: can you read a cell's type off it?
Why cell type first?
Cell type is the strongest signal in single-cell data. The biggest differences between any two cells in a tissue are almost always differences of identity: each cell type switches on its own characteristic set of genes, and those cell-type-specific patterns make up a gene program. The genes a plasma cell runs and the ones a fibroblast runs barely overlap. Differences of state, like whether a cell is stressed or inflamed, come only second. Open any scRNA-seq atlas and the first thing anyone does is cluster the cells into types, because that structure dominates everything else.
So it's the right first test. If pretraining captured the single strongest pattern in the data, a cell's type should be legible in its embedding. A model that misses it won't pick up the subtler signal that disease asks for.
The cell embedding: one vector per cell
A pretrained model's real output is a representation, not a prediction. For a single-cell model that representation is the cell embedding: the model's compressed summary of one cell, a single point in 256-dimensional space. You pretrain once on unlabeled data and keep a reusable vector per cell, which later tasks can be attached to cheaply, including tasks the pretraining never saw. Cell type here, disease in part 4, perturbation in part 5: all three read the same vector.
What it is. Part 2 fed each cell's ranked sentence through the transformer, which returns a contextual vector for every gene in the cell: 256 numbers describing that gene in the company of all the others. That's rich, but unwieldy, and a different size for every cell: our inflammatory fibroblast from part 1 has 229 gene vectors, a plasma cell only 35. To get one fixed-size handle per cell, we average those gene vectors into a single 256-d vector, pooling over the genes the cell actually expresses (and skipping the PAD slots). One cell in, 256 numbers out, however many genes it had.
Concretely, it's a column-wise average: stack the cell's gene vectors and average straight down each dimension (shown here at a toy width of 4 instead of 256):
gene A   [ 0.2, -0.5,  0.1,  0.8 ]
gene B   [ 0.4, -0.3,  0.0,  0.6 ]
gene C   [ 0.0, -0.1,  0.2,  0.4 ]
─────────────────────────────────   average each column ↓
cell [ 0.2, -0.3, 0.1, 0.6 ] ← the cell embeddingWith 256 columns and however many genes the cell expressed, it's the same move: one 256-number vector standing in for the whole cell. In symbols, the cell embedding is the mean of the cell's gene vectors, , with in the toy above (the first column is ), and for our fibroblast, for the plasma cell.
How to get it. A few lines: run the frozen encoder, then average over the real (non-pad) positions.
@torch.no_grad()
# tokens: (cells, 1024) gene ids, 0 = PAD
def cell_embedding(self, tokens):
    # (cells, 1024, 256): one vector per gene
    h = self.encode(tokens)
    # mark the real genes, drop the padding
    keep = (tokens != PAD).unsqueeze(-1)
    # (cells, 256): mean over real genes
return (h * keep).sum(1) / keep.sum(1)Run it once over the 100,000-cell subsample from part 1 with the weights frozen, and you get the table the rest of this post uses (a (100000, 256) matrix, one row per cell), computed once and cached to disk. No labels ever touch it.
What it's good for. A fixed-size, label-free vector per cell is the workhorse output of a foundation model, because it drops straight into standard tools:
- Cluster it to find cell types without markers (the islands in the t-SNE below).
- Classify it: fit a small model on top to read a label off it (the cell-type classifier here; disease in part 4).
- Visualize it: project to 2-D with t-SNE or UMAP for an atlas-style map.
- Search it: rank cells by cosine distance to ask "what else looks like this one?"
The bet of pretraining is that this one vector (learned only by filling in masked genes) is good enough to serve all of these, so you compute it once and reuse it instead of hand-engineering features for each task. The rest of this post tests that bet on the most basic version of the question: can a cell's type be read straight off its embedding?
You can't answer that by looking at the vector. Nothing in the 256 numbers says which directions mean plasma cell and which mean fibroblast. You do have the atlas's own annotation, a curated type for every cell, so the check becomes a measurement: given only the embedding, how reliably can that type be recovered? That test has a standard name, the linear probe.
What a linear classifier measures
A linear classifier is a simple test of what the model learned. You freeze the pretrained model (its weights stay fixed) and train one small classifier on top of its output. How well that classifier reads a label tells you what the embedding already contains.
We keep the classifier linear (logistic regression) on purpose. A linear classifier can only use information the embedding already presents clearly; it isn't powerful enough to uncover something buried. So if a linear classifier reads cell type well, the embedding must already hold cell type in an easy-to-read form, which is exactly what we want to check.
Three rules keep the test honest:
- Freeze the model. No fine-tuning: we grade the pretrained representation as-is, not a new model built on its weights.
- Read the frozen embedding. The classifier's input is the 256-d cell embedding from above, unchanged for this task. That fixed vector is on trial.
- Hold out whole patients. Train the classifier on cells from one set of patients, test on cells from patients it never saw (the patient split from part 1). A random cell-level split would let the classifier cheat by recognizing a patient rather than reading biology.
# a linear classifier on the frozen embedding
# frozen 256-d cell embedding
emb = embed_all(model, tokens)
# a LINEAR classifier
clf = LogisticRegression(max_iter=3000)
# fit on train patients
clf.fit(emb[train], celltype[train])
# grade on held-out patients
score(clf, emb[val], celltype[val])What the classifier actually sees. Only those pooled vectors, each paired with a label. No genes, no counts, no ranked sentence. The classifier's training input is a plain table: one row per training cell, 256 columns wide, each tagged with that cell's type.
X  (classifier input)   shape (80209, 256)   one frozen embedding per train cell
  cell 4     [ +0.01, -0.78, -0.32, -1.07,  …,  -0.13 ]   →   Plasma
  cell 9     [ +0.28, +0.52, +0.20, +0.07,  …,  -0.03 ]   →   Inflammatory Fibroblasts
  cell 124   [ -0.21, +0.69, -0.35, +1.01,  …,  -0.70 ]   →   Goblet
  …                                                          (one of 51 types)
y (labels) the annotated cell type of each cellLogistic regression hunts for directions in this 256-dimensional space that line up with each type. It learns one weight vector per type, 51 of them, each with one weight per embedding dimension, and scores a cell by taking the dot product of that vector with the cell's embedding :
The dot product is a similarity score: multiply each of the 256 numbers by that type's weight for it, then add everything up. A dimension the Plasma weights find useful gets a large weight, one they find irrelevant gets a weight near zero, so comes out high for cells whose embedding leans in the plasma-cell direction and low for everything else. The term is a fixed offset per type, which lets the classifier account for some types simply being far more common than others.
That leaves 51 raw scores per cell, on no particular scale. A softmax turns them into probabilities that sum to 1: exponentiate each score, then divide by the total.
With three types instead of 51, to keep the arithmetic visible:
type          score s_c    e^s_c      probability p_c
Plasma            4.0      54.60      54.60 / 60.73 = 0.90
Goblet            1.5       4.48       4.48 / 60.73 = 0.07
Fibroblast        0.5       1.65       1.65 / 60.73 = 0.03
                          ──────                     ────
60.73 1.00Exponentiating first makes the leader dominate. Plasma beats Goblet by 2.5 on the raw score, but , so it ends up about twelve times more probable. The predicted type is whichever is largest, and accuracy just asks how often that one is correct.
Those 256 numbers came from the masked-gene objective in part 2, with no cell-type label ever shown. The classifier only asks whether identity is already sitting in the vectors, linearly readable.
The baseline: 50 principal components
A classifier score means nothing on its own. Is 80% good? So we need a baseline that answers: did pretraining buy us anything a simple linear method wouldn't have found in the raw data?
The obvious control is PCA, which we already computed in part 1. Take the same log-normalized expression matrix, keep its top 50 principal components, and classify those with the same logistic regression on the same patient split. PCA is a purely linear summary of the raw numbers: no pretraining, no transformer. It is the "did you beat a spreadsheet" bar, and for cell typing it is a strong one: PCA-then-cluster is how most of the field assigns cell types in the first place.
The result
Smillie's atlas is annotated into 51 fine-grained cell types: not just "T cell" but CD4+ Memory, CD8+ LP, Cycling TA, Immature Goblet, and so on. It's a hard 51-way problem, and the easiest way in is to look at those 256-number vectors first. Here is a t-SNE of the frozen cell embeddings next to one of PCA, each cell coloured by its major lineage (the 51 fine types collapsed into 7 compartments):
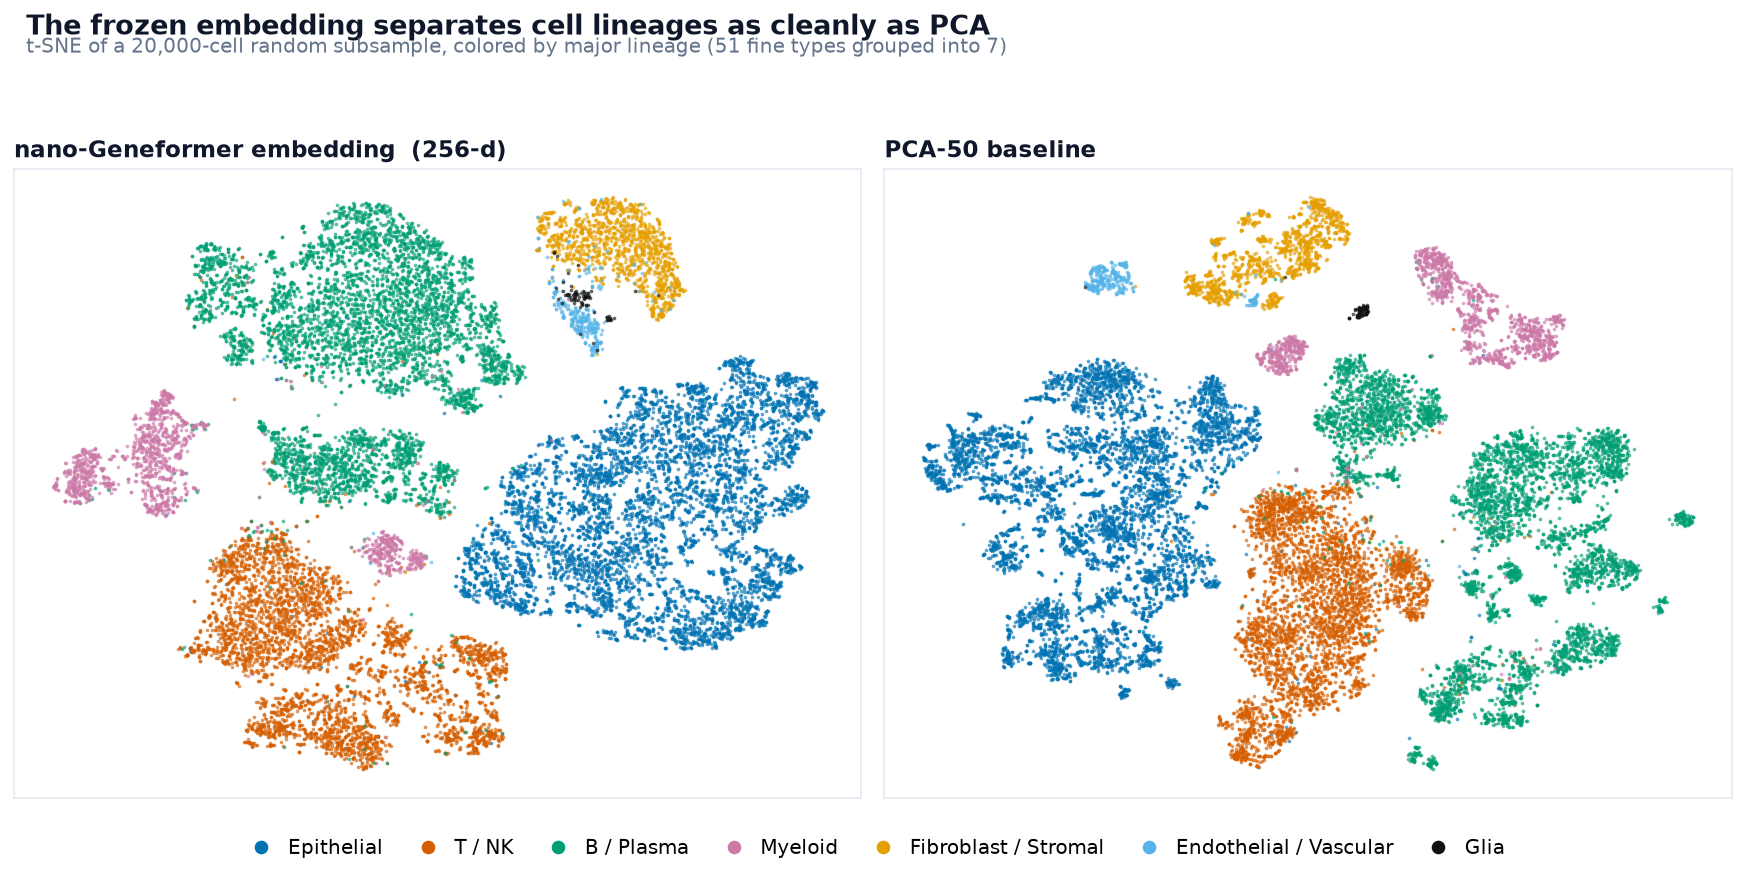
Both maps break the tissue into the same clean islands (epithelium, plasma cells, T/NK, myeloid, the stromal trio of fibroblast/endothelial/glia sitting together), and the embedding's version is every bit as organized as PCA's. A label-free transformer arranged cells by identity, about as cleanly as the field's standard linear method.
But a t-SNE can flatter: it's a 2-D cartoon, and it can suggest structure that isn't really separable. So we measure it properly: train the linear classifier and count how often it names the right type on held-out patients, against two floors: blind chance, and always-guess-Plasma.
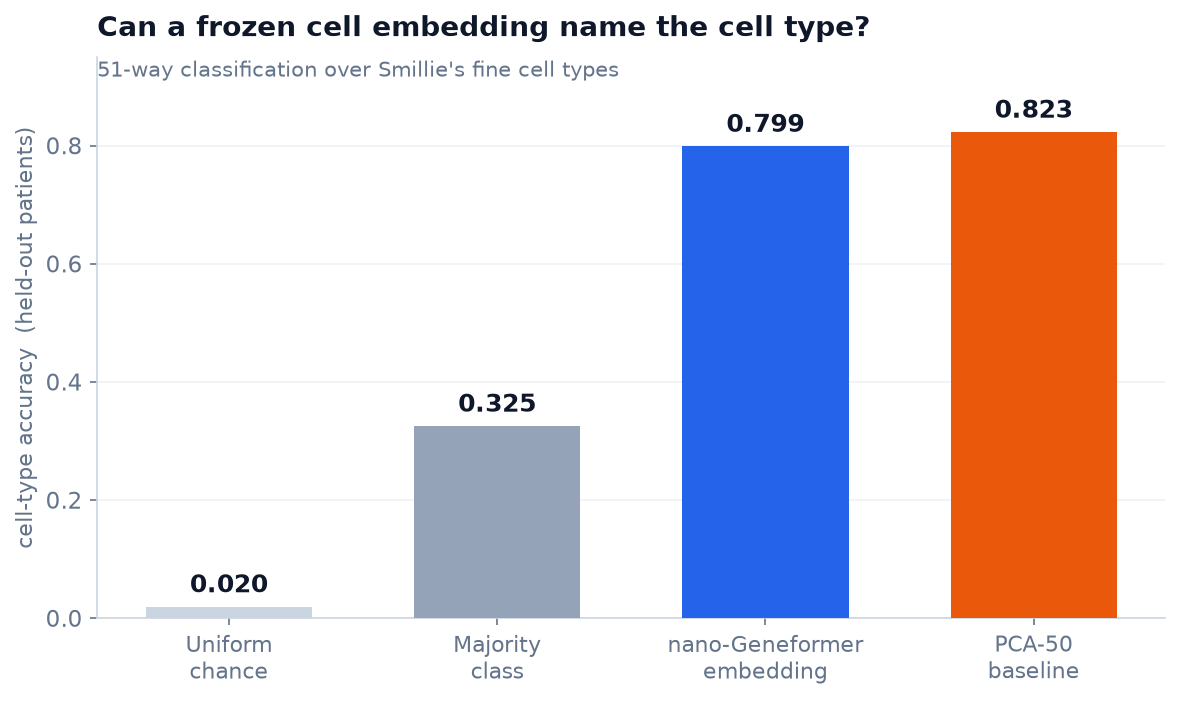
Read the bars top to bottom: a raw accuracy means little until you know what's easy. Accuracy here is the fraction of held-out cells the classifier labels exactly right: the correct one of 51 types, first guess. And "held-out" is strict: these are the 19,791 cells from the six patients kept out of training entirely, unseen by both the pretrained encoder and the classifier, so the number is real generalization, not a memorized batch. The two grey bars are the floors that give it scale.
- Blind chance: 2.0%. With 51 types, labelling cells at random is right about one time in fifty: the floor for pure guessing, not what a trained classifier scores. A classifier that learned nothing useful from the embedding wouldn't guess randomly; it would fall back on the single most common type (the 32.5% floor below).
- Always-guess-
Plasma: 32.5%. The laziest non-random strategy: plasma cells are the single most common type in this atlas, so on the held-out cells, labelling every cellPlasmais right 32.5% of the time. Clearing this floor is the bar that matters: it shows the classifier is telling types apart, not just cashing in on one class being common.
Against those floors, 79.9% clears them: roughly 40× blind chance, and two and a half times the always-Plasma floor. The embedding reads a cell's type off 256 numbers.
And it does so right behind PCA's 82.3%, at 97% of the baseline's accuracy. PCA still edges it out: with no cell-type labels anywhere in training, the embedding matches the field's standard method without beating it. Part 4 picks up that small gap when it turns from cell type to disease.
(Accuracy flatters the common types; on the balanced macro-averaged F1 the same ordering holds: embedding 0.63, PCA 0.68. The model is a little weaker on the rare types, but the story is the same.)
Coarse identity, fine subtypes
That 79.9% is a 51-way score, a hard way to grade a classifier. Most of the errors are the model picking the wrong subtype within the right family, not missing a cell's identity. To see that, relabel every cell with its lineage, one of seven instead of one of 51, and fit the same logistic regression again on the same embedding and the same held-out patients:
| distinction | embed | PCA |
|---|---|---|
| coarse: 7 major lineages | 97.6% | 98.1% |
| fine: 51 cell types | 79.9% | 82.3% |
On the seven major lineages (epithelial, T/NK, B/plasma, myeloid, fibroblast, endothelial, glia) the embedding puts 97.6% of held-out cells in the right compartment, essentially tying PCA. Seven classes is an easier task than 51, so it needs its own floor: blind chance is 14.3%, and always answering B / Plasma, the largest lineage here, gets 37.2%. Against that, 97.6% means it reliably tells a fibroblast from a T cell from a plasma cell.
The errors at the fine level are mostly inside those compartments. Take the 51-way predictions and ask, for each cell it got wrong, whether the type it did name at least belongs to the right lineage: 88% of the mistakes do. Only 12% cross a lineage boundary. The rest are calls like which flavour of CD4 T cell, or which enterocyte progenitor.
Which fine types it gets right comes down mostly to how many it saw. Score each of the 51 types on its own and plot it against that type's number of training cells:
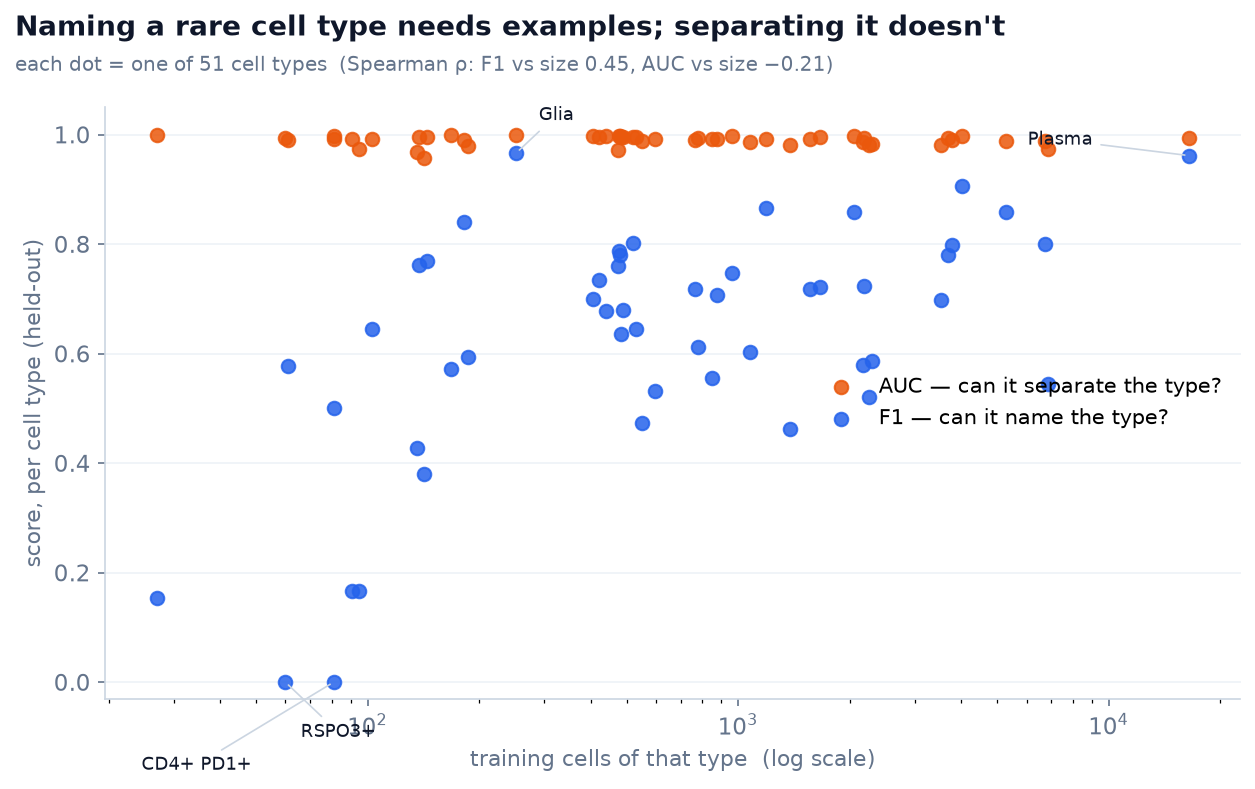
The blue F1 points climb with sample size (Spearman ρ = 0.45): common types average 0.72, rare ones (under 200 training cells) only 0.44. The near-zero cases, CD4+ PD1+ and RSPO3+, are the rarest, a few dozen cells each. Sample size isn't the whole story (Glia is uncommon too, ~250 cells, yet scores 0.97 because it's a distinct lineage rather than a subtle subtype), but it's the main lever.
The orange AUC points tell the other half. ROC-AUC asks a gentler question (not "is this the single top guess out of 51?" but "does the classifier rank this type's cells above the rest?"), and by that measure every type scores near-perfect regardless of size: the band sits at ~0.99 straight across, and even the F1 = 0 failures come back at AUC 0.99. The embedding can separate those rare types; a 20-cell type can't win a 51-way argmax against its bigger neighbours. Over all 51 types the macro-averaged AUC is 0.990 for the embedding and 0.992 for PCA: near-perfect, and all but tied.
A concrete case makes the split clear. Take the 23 held-out CD4+ PD1+ cells. The classifier never names one of them correctly. Every cell is called a neighbouring T-cell type, almost all of them CD4, so the confusion at least stays inside the right lineage:
what the classifier names the 23 held-out CD4+ PD1+ cells:
  13 → Tregs     5 → CD4+ Memory     4 → CD4+ Activated     1 → CD8+ LP
→ it names CD4+ PD1+ zero times, so F1 = 0But naming is only the argmax (, the single highest-probability type). Look at the probability the classifier assigns instead. Averaged over these cells it puts 0.10 on the true label CD4+ PD1+, behind Tregs (0.36) and CD4+ Memory (0.28), so it never wins the vote, but that 0.10 is real signal. And it is against a baseline of 0.0004: the probability the classifier gives "CD4+ PD1+" to a random other cell in the atlas. The true cells carry roughly 250× more of that signal than everything else, so ranking every cell by it floats them straight to the top, which is exactly what an AUC of 0.99 measures. F1 = 0 and AUC = 0.99 are describing the very same cells.
So the honest read: the embedding captures identity at the lineage level, near-perfectly, and even the rare cells it can't name at the finest level, it can still tell apart. It gives up little to PCA, and mostly where a fine subtype brought few examples.
Why this works: ranking keeps identity
The embedding captures cell type as a direct consequence of the encoding choice from part 1.
A cell type is a gene program: a set of genes a cell turns on together. A fibroblast runs the collagen program (COL1A1, COL3A1, LUM), a plasma cell the antibody program (immunoglobulins), a goblet cell the mucus program (MUC2, TFF3). Identity is fundamentally about which genes are on and which dominate.
Rank encoding preserves exactly that. It records which genes a cell pushes to the top of its sentence, dropping only how much, and part 1 already showed a marker gene landing at rank 1 in most cells, unsupervised. So a fibroblast and another fibroblast produce nearly the same sentence, and a fibroblast and a plasma cell produce very different ones. Same type looks alike, different types look different, which is precisely the structure a type classifier needs.
What we tested
We froze a label-free pretrained model, reduced each cell to one embedding, and asked a linear classifier to name its type, on patients the model had never seen. It gets 51 fine types right ~80% of the time, essentially matching a strong PCA baseline. Pretraining captured the strongest signal in the data, with no labels.
But identity is the easy signal, the one ranking was always going to keep. We built this model for a harder question: not what type a cell is, but what state it's in (healthy, or inflamed). That is where the rank encoding's one big sacrifice starts to bite. Part 4 puts disease on trial.